The Top 100 European Software vendors

The European software industry ranking.

Your Truffle100 account. For free.

2008


Editorial

    Viviane Reding

    Viviane Reding

    Once again, the Truffle 100 brings into focus Europe’s dynamic software industry, which more than ever in these uncertain economic times holds out hope for creation of jobs and wealth. The European software industry is distinguished by its capacity for innovation, tremendous technical skills, and highly skilled engineering workforce. These are all advantages in a time of industrial consolidation. But Europe still needs to produce not just one or two but tens of global champions in order to respond to the pressures of competition.

    The paradigm changes that are sweeping the industry – from software as a service to open source software – may be Europe’s best bet to catch up, since we are strong in these areas. At both national and European levels there is a great willingness to support Europe’s software companies. We welcome the arrival of this year’s Truffle 100 as a highly regarded and very valuable tool in measuring and highlighting their progress.

    Viviane Reding
    EU Commissioner for Information Society & Media

    Léo Apotheker

    Léo Apotheker

    OIn the last few months, the global economy has become even more challenging and taken unexpected turns. Software is a vital element of the global economy, and is woven into all aspects of business and commerce. We are facing challenges today that we have not faced before. But I firmly believe that our industry – IT – has the ability to initiate change and turn adversity into an advantage like no other industry can. And as a result, help the economy regain its strength. Indeed, effective adoption of IT and software will be instrumental for Europe in establishing global leadership in the digital economy – a prerequisite for sustaining growth, jobs, and productivity in the next decade.

    It is our daily business at SAP to reinvent and adapt ourselves to the ever-changing demands of our customers. This ability has made SAP the worldwide leader in business applications in the past, and has lead to our leading the Truffle 100 three years in a row. I strongly believe that strategic agility is what is needed for a company to thrive in a global networked economy.

    In a time that demands both focus and transparency from companies, it is software solutions that enable businesses to do so. SAP’s more than 35 years of experience has demonstrated that we continue to benefit greatly from what we call our “ecosystem.” We can achieve much greater – and more sustainable – benefits for our customers if we work in cooperation and not in competition.

    The overall paradigm is shifting: We are moving from vertical value chains to business networks. We see the signs that prove it. 1) An increased focus on customers and their needs instead of an internal company-centric approach, and 2) The “command and control” attitude has ceased to work. In today’s economy, business is all about the connection and collaboration within an ecosystem. Having said that, it is clear that the best model of doing business will be relationship driven well into the future.

    “The software industry is synonymous with innovation – today’s economy is driven by great ideas fuelled by software solutions.” I said this to you two years ago. I still believe that today, this is truer than ever. I hope that we all succeed in driving innovation farther, and that the software sector can once again demonstrate agility and provide it to businesses of all kinds and sizes in these challenging times.

    Léo Apotheker
    Eco-CEO, SAP AG

    Bernard-Louis Roques

    Bernard-Louis Roques

    We are pleased to present the latest version of the Truffle 100, the leading ranking of the top 100 software vendors in Europe. Economic uncertainty notwithstanding, we remain highly optimistic about the future of the European software industry. The Truffle 100 vendors have always shown great resilience in the face of difficulties and we can count on them to remain a strategic and dynamic engine of value growth for European economies.

    Creative, relentlessly innovative, strong investors in R&D (over 15% of revenues), Europe’s vendors are a major provider of new, highly qualified jobs as well as a major contributor of tax revenues (1 bne). The industry continues to undergo massive transformations as it confronts two major trends: consolidation at a global level and the emergence of new business models such as Software as a Service and Open Source.

    To help our industry meet these challenges, we urge European authorities to take swift and bold action. Necessary reforms include setting up an European SBA (small Business Act) actively promoting at an european level the Young Innovative Company (YIC) tax efficient framework, and facilitating access to R&D programs for SMEs by cutting unnecessary administrative steps. Only then will European vendors be able to compete on an equal footing with their American counterparts.

    I want to thank IDC, CXP and the National trade associations for their work and support in preparing the Truffle 100.

    Bernard-Louis Roques ,
    General Partner & co-Founder,
    Truffle Capital

Figures


Revenues > 24 bn€

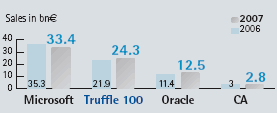
Total revenues for the Truffle 100 are 29 bn€
Revenues from software activity are 24,4 bn€

A concentrated industry : 80 % of revenues come from the top 25 vendors

vendors (% revenues Truffle 100)
SAP 42 %
TOP 3 55 %
TOP 5 59 %
TOP 10 67 %
TOP 50 91 %

39 vendors have revenues > 100 m€ (up from 30 one year ago);
they account for 87 % of Truffle 100 revenues

European, software vendors growth, 2008

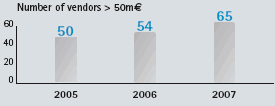
65 vendors have revenues > 50 m€
they account for 95 % of Truffle 100 revenues

All Truffle 100 have revenues > 25 m€
(up from 20 m€ one year ago)

World-class national champions

Vendor Country Revenues € million % of Truffle 100

SAP

DE

10 269

42.2 %

Sage

UK

1 787

7.3 %

Dassault Systemes

FR

1 259

5.2 %

Gruppo Engineering

IT

467

1.9 %

Visma ASA

NO

338

1.4 %

UNIT4 AGRESSO NV

NL

320

1.3 %

Insufficiently diversified

  • 1/3 of the Truffle 100 are in the ERP or related business
  • Another 1/3 is composed of infrastructure software vendors
  • Overweght of Financial software and Public sector software

Facing global competition

European, software vendors growth, 2008

A profitable industry

3.2 bn€ aggregated net profits,
up from 2.8bn€ last year

11 % of revenues (10.7% last year)

  Revenues Truffle 100 Profit Truffle 100 Profits last year

SAP

42 %

60 %

67 %

TOP 3

55 %

73 %

83 %

TOP 5

59 %

75 %

90 %

TOP 50

91 %

95 %

97 %

Size matters, with limitations: the most profitable companies are not the biggest

Profits grow with size, but not linearly

Profitability
(% of revenues)

Top 3

9.6

Top 50

12.5

Last 50

0.7

… and growing fast

Revenues growth year on year: +10.3 %

Despite significant consolidation at a global level

European, software vendors growth, 2008

Dependant on capital markets

84 % of  the Truffle 100 are quoted
They account for 94 % of sales
… and 98.2 % of profits

Breakdown by country

Countries % of Truffle 100 Number of vendors % of population*

DE

48.1 %

11

17.6 %

UK

18.2 %

22

12.7 %

FR

11.8 %

20

12.8 %

Nordic countries

8.8 %

23

5.2 %

IT

7.6 %

12

12.3 %

NL

2.8 %

4

3.5 %

*Total population, UE (25 countries) + Switzerland + Norway= 469 M

The Truffle 100 is compiled from survey & research conducted by IDC & CXP.
Europe is defined as: EU 25 countries + Switzerland + Norway. The companies taking part have certified that they operate under European law and that their headquarters and R&D are based in Europe (as defined above). The ranking was made exclusively on the basis of the data declared and submitted by each company taking part and, at the exception of Italy, validated in some cases by external sources. Information of a confidential nature (e.g. net income), are only presented on an aggregated basis. The authors are not responsible for any content or error, omission or inaccuracy related to content communicated by third parties.

Surveys and compilation:

  • Stephane Krawczyk - skrawczyk@idc.com
    Catherine Brault - cbrault@lecxp.com

Publication Manager :

  • Bernard-Louis Roques- bernie@truffle.com

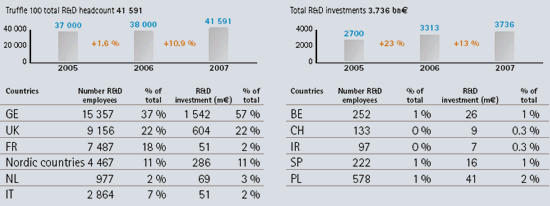
Hightly qualified workforce of ~ 194 000

Hightly qualified workforce of ~ 194 000

Strategic R&D firepower

The Truffle 100 is an dynamic and strategic provider of qualified jobs in Europe

Strategic R&D firepower of ~ 3.7 bn€

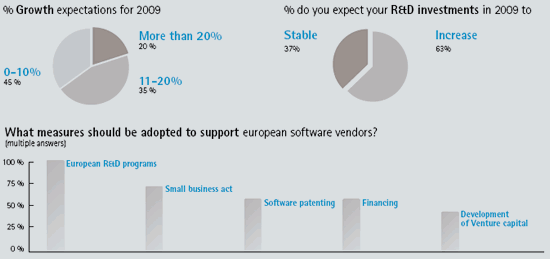
An optimistic & resilient industry

An optimistic & resilient industry


Ranking

Rank

Company

HQ

Revenues 2007 from Software activity (m€)

Total revenues 2007 (m€)

R&D headcount 2007*

1

SAP

DE

10 269.3

10 269.3

12951

2

SAGE

UK

1 787.1

1 787.1

2314

3

DASSAULT SYSTEMES

FR

1 258.8

1 258.8

3349

4

SOFTWARE AG

DE

615.5

621.3

676

5

GRUPPO ENGINEERING

IT

467.0

709.0

220

6

MISYS PLC

UK

416.9

832.4

1415

7

ELSAG DATAMAT

IT

410.0

633.5

332

8

VISMA ASA

NO

337.9

337.9

574

9

NORTHGATE

UK

337.4

519.9

1118

10

UNIT4 AGRESSO NV

NL

320.5

320.5

490

11

REPLY

IT

274.7

277.2

471

12

SOPRA GROUP - AXWAY

FR

265.0

1 001.4

1100

13

IFS (Industrial and Financial Systems)

SE

254.9

254.9

732

14

ANITE GROUP PLC

UK

253.8

253.8

378

15

EXACT HOLDING NV

NL

252.1

252.1

290

16

AUTONOMY

UK

251.0

251.0

646

17

KOFAX (Ex Dicom Group Plc)

UK

237.2

237.2

322

18

ALMAVIVA SPA

IT

234.7

652.0

20

19

CEGID

FR

207.4(*)

241.1

450

20

GL TRADE

FR

203.2

203.2

550

21

FIDESSA

UK

200.0

200.0

340

22

TELELOGIC AB

SE

185.8

185.8

346

23

CIVICA PLC

UK

177.0

186.3

1019

24

IBS AB

SE

175.0

236.0

330

25

ZUCCHETTI

IT

168.0

196.0

1000

26

SIMCORP A/V

DK

156.8

156.8

492

27

ASSECO

PL

147.0

340.0

578

28

NEMETSCHEK AG

DE

146.2

146.2

405

29

MICRO FOCUS INTERNATIONAL PLC

UK

132.8

132.8

141

30

SOPHOS PLC

UK

132.4

132.4

422

31

IDS SHEER AG

DE

127.5

393.5

230

32

ILOG

FR

123.2

123.2

199

33

LMS INTERNATIONAL

BE

120.0

120.0

164

34

GFI INFORMATIQUE

FR

120.0

688.5

160

35

AVANQUEST SOFTWARE

FR

113.8

113.8

200

36

PANDA SECURITY

SP

109.0

109.0

185

37

PSI AG

DE

105.8

123.2

135

38

Digia

FI

105.8

105.8

180

39

LINEDATA SERVICES

FR

100.0

164.8

200

40

LHS AG

DE

98.2

98.2

212

41

F-SECURE OYJ

FI

96.8

96.8

207

42

IRIS GROUP SA

BE

95.9

95.9

88

43

ICT AUTOMATISIERING NV

NL

88.3

88.3

150

44

BETA SYSTEMS SOFTWARE AG

DE

86.8

88.6

151

45

COMPTEL OYJ

FI

82.4

82.4

146

46

FAST SEARCH & TRANSFER ASA (FAST)

NO

78.4

104.5

178

47

INTEGRALIS AG

DE

75.0

157.0

267

48

ALDATA SOLUTION

FI

74.7

74.7

166

49

CENIT AG SYSTEMHAUS

DE

74.6

77.1

131

50

GENERIX GROUP

FR

74.0

75.0

165

51

BASWARE

FI

73.0

73.0

152

52

ESI GROUP

FR

68.9

68.9

196

53

VIZRT LTD.

NO

63.2

63.2

141

54

EXPRIVIA S.p.A.

IT

62.6

62.6

106

55

KEWILL SYSTEMS PLC

UK

61.4

61.4

78

56

FJH AG

DE

60.1

63.3

94

57

CEGEDIM ACTIV (Groupe Cegedim)

FR

60.0

62.2

250

58

UTIMACO SAFEWARE AG

DE

59.2

59.2

106

59

ALPHAMERIC PLC

UK

58.0

58.0

43

60

ORC SOFTWARE AB

SE

57.2

57.2

97

61

SSP HOLDING (Ex Sirius Financial Solutions Plc)

UK

57.0

57.0

97

62

TXT E-SOLUTIONS

IT

55.5

55.5

75

63

SOFTWARE INNOVATION ASA

NO

54.5

54.5

58

64

SOGEI SPA

IT

52.6

331.4

45

65

IONA TECHNOLOGIES

IR

51.8

56.8

97

66

READSOFT

SE

48.5

52.5

89

67

OTRUM ASA

NO

47.5

50.0

85

68

MACRO 4 PLC

UK

46.1

46.1

78

69

DELCAM PLC

UK

43.4

43.4

16

70

PROHA OYJ

FI

43.4

51.0

24

71

BIS (Bond International Software Plc)

UK

43.1

43.1

106

72

SDL

UK

41.6

148.6

253

73

INFOVISTA

FR

39.8

39.8

86

74

TEKLA OYJ

FI

39.3

59.3

101

75

CINECA

IT

39.2

49.0

440

76

META4

SP

38.8

21.8

37

77

CREALOGIX HOLDING AG

CH

37.8

37.8

64

78

ARM HOLDING

UK

37.3

367.6

140

79

ELCA

CH

36.6

38.3

69

80

SAB (GROUPE)

FR

36.0

36.0

200

81

MINORPLANET SYSTEMS PLC

UK

35.7

35.7

25

82

SUPEROFFICE ASA

NO

35.4

39.3

40

83

BOSS MEDIA AB

SE

35.0

35.0

110

84

VIVEO

FR

35.0

55.0

80

85

OPERA SOFTWARE ASA

NO

35.0

35.0

59

86

DEDA GROUP

IT

34.2

85.4

30

87

NORMAN ASA

NO

33.7

33.7

85

88

GRUPPO FORMULA

IT

32.8

32.8

56

89

FINANCIAL OBJECTS PLC

UK

31.0

31.0

4

90

CCS (Clarity Commerce Solutions Plc)

UK

30.7

30.7

48

91

IBS OPENSYSTEMS PLC

UK

30.6

30.6

8

92

MACONOMY A/S

DK

30.0

30.0

75

93

ARES

FR

29.1

411.0

55

94

INAZ SRL

IT

29.0

35.2

69

95

ORSYP

FR

28.2

28.2

57

96

AFAS ERP SOFTWARE

NL

27.9

27.9

47

97

MISSLER SOFTWARE

FR

27.1

27.1

80

98

EBP

FR

27.0

27.0

63

99

CAST

FR

26.1

30.6

54

100

ESKER

FR

25.9

25.9

56

(*)Revenues Cegid 2007 taken from IDC Report "Le marché français de l 'ERP et des logiciels de gestion - Bilan et perspectives 2007 - 2012"